Satellite Images Track Contrasting Storm Systems Across the Pacific
In-fa’s circular eye and a sprawling northern system illustrate two different storm structures.
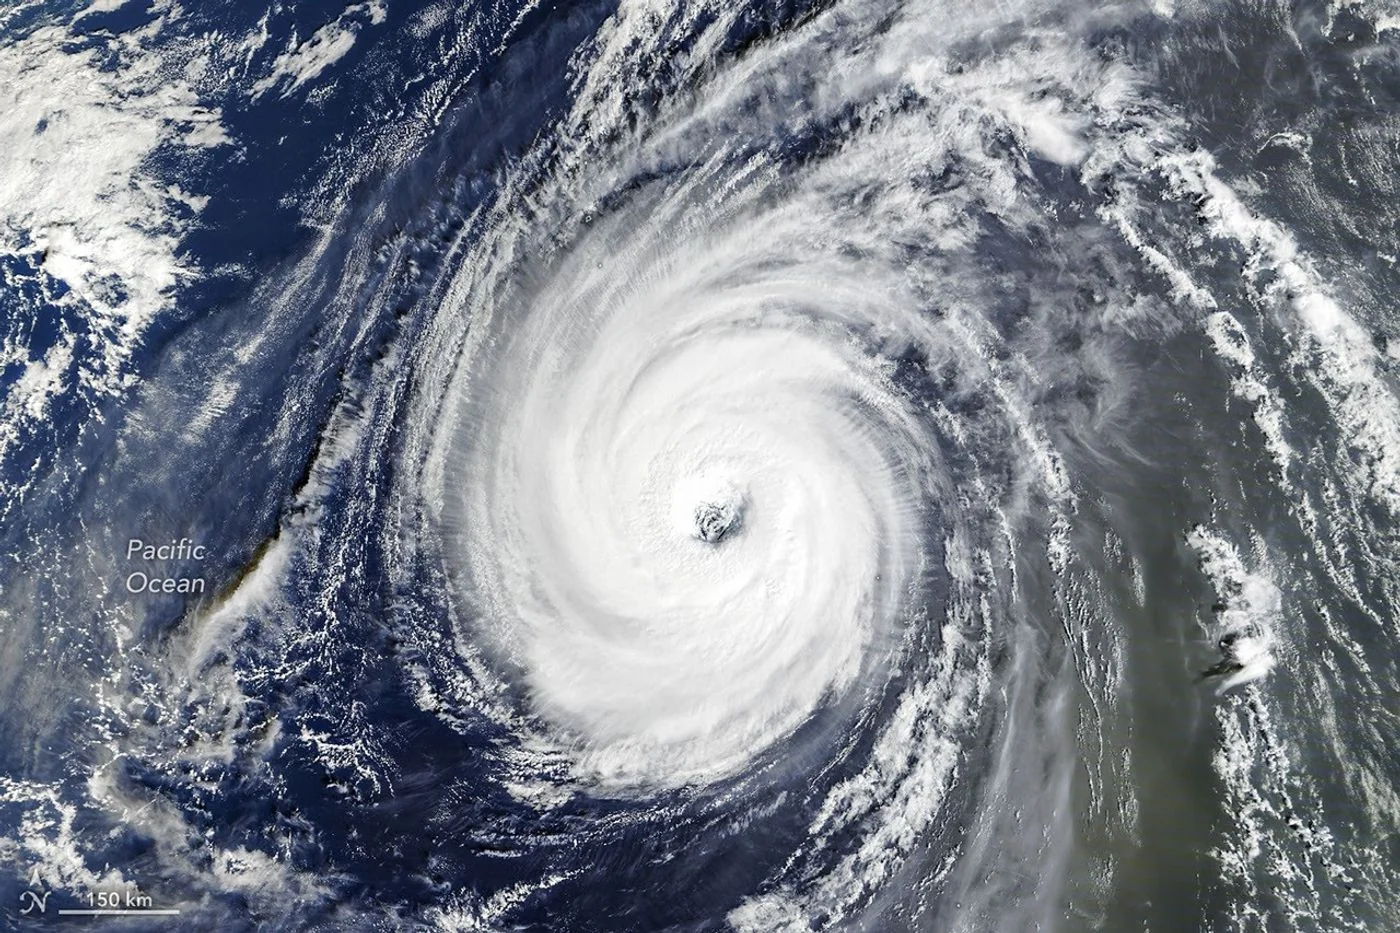
Two systems in one ocean
NASA imagery released on November 3 documents an active late-October Pacific. Typhoon In-fa appeared near the Mariana Islands, while the remnants of Champi became involved in a larger storm system approaching Alaska. The observations show weather evolving across widely separated parts of the basin.
A distinctive eye
A Terra satellite image from October 30 shows In-fa with a large eye and an almost circular cloud field. NASA describes these features as characteristic of an annular tropical cyclone, a relatively uncommon structure with less prominent outer spiral bands.
A changing source of energy
Farther north, Champi’s remnants had undergone extratropical transition. Such systems can develop fronts and broad comma-shaped clouds as they interact with temperature contrasts. That change can enlarge the area affected by wind even when the storm no longer fits the familiar tropical-cyclone pattern.
Background and interpretation. The following sections add editorial explanation to the dated report. Hypothetical examples are illustrations, not newly reported events or interviews.
One basin can contain very different weather stories
The Pacific is large enough for multiple systems to be at different stages of development at the same time. Placing them in one account provides geographic context, but it does not establish a direct interaction between every storm mentioned. The article's observations concern widely separated locations and different kinds of organization. A useful reading begins by locating each system and attaching the correct timestamp to its image. This avoids treating the ocean basin as a single local weather map on which every visible circulation must have developed for the same reason or affected the same communities.
Why the eye attracts attention
A well-defined eye offers a visually memorable centre, making the storm easier to recognize in a satellite image. The source uses the eye and the surrounding cloud arrangement to explain In-fa's appearance. The reader should still distinguish an identified structural feature from a complete assessment of intensity. A photograph may show organization clearly while leaving other quantities to separate measurements. The shape can be scientifically interesting without becoming an informal severity scale in which a larger or cleaner-looking eye is automatically assumed to imply a particular wind speed.
Understanding a structural description
A term such as annular describes a pattern recognized in the original account. It should not be treated as a promise that the storm will remain unchanged or follow a predictable path. Weather systems evolve, and a description belongs to the period assessed. For a general reader, the practical benefit of the label is that it directs attention to the relationship between the eye, the surrounding cloud field and the less prominent outer bands. The label supports observation and comparison; it does not replace the forecasts or local assessments needed to understand later developments.
A second system has its own history
The remnants discussed near the North Pacific should be followed through their own sequence of observations and reports. A system's earlier tropical identity can be relevant to its history while its later organization is influenced by a different setting. NOAA's discussion of extratropical transition provides useful background for understanding why the same weather feature may be described differently over time. The source's dated account remains the basis for this particular event. General transition background should not be used to invent an unreported position, intensity or effect between the observations available.
Comparing pictures acquired at different moments
Two images displayed together may feel simultaneous even when they are not. Acquisition times, instruments and coverage can differ. A careful comparison would first decide whether it is examining the same moment across a wide area or illustrating several stages across a period. Both approaches are useful if the presentation explains the choice. Without that explanation, a reader might infer a relationship from the page layout rather than from meteorological evidence. The visual arrangement of an article is an editorial decision, while interaction between weather systems is a scientific claim requiring its own support.
What a hypothetical basin-wide timeline would show
Imagine a timeline with one row for each system and dated observations placed along it. Some intervals would overlap, some would contain gaps and some would show changes in terminology. Such a timeline would help a reader separate coincidence from sequence. It would not demonstrate that one system caused another. The exercise is useful because a busy season can otherwise become a list of names with little structure. Preserving the timing makes the story easier to follow while keeping the evidence for each system distinct and the unobserved intervals visible.
Why an active period is not automatically a climate conclusion
A cluster of interesting storm images can illustrate an active period, but it is not by itself a statistical analysis of a climate trend. A trend question requires a consistent record, an appropriate comparison period and a defined measure of activity. Counting only the storms selected for publication would introduce an editorial filter into the supposed dataset. The article can describe the reported period without claiming that those selected scenes establish how the whole basin has changed over decades. That distinction protects both the event reporting and the more demanding work of climate analysis.
Keeping the reader's practical question in view
A person looking for a current warning may ask where the storm is now, while a science reader may ask why its cloud structure looked unusual. Those are different needs. This article addresses a historical observation and its context. The dates and source links help a reader recognize that purpose before applying the information. A striking satellite scene can remain valuable long after an event, but it should not be circulated without the metadata that distinguishes an archive explanation from current operational advice for a coast, a voyage or a flight.
A more informative way to see a busy ocean
The value of combining these observations is not simply the number of storms visible in the story. It is the chance to compare location, structure and stage while noticing how much context a recognizable swirl leaves unstated. A disciplined reading follows each system separately, identifies what the instruments showed and reserves broader claims for suitable evidence. That approach lets the Pacific account remain visually engaging without implying that one picture explains a season, that a structural label predicts an outcome or that neighbouring entries on a page establish a physical connection.
A basin-wide view needs a consistent clock
Large geographic comparisons can cross time zones and calendar boundaries. A consistent reference such as UTC helps align observations, while local dates remain useful for describing an event to the people in a particular place. Mixing the two without explanation can make separate observations appear out of order. A careful timeline would therefore retain the original timestamp and label any conversion. This is a practical editorial step rather than a new weather finding. It helps readers compare the Pacific scenes as dated records instead of assuming that every picture labelled with the same calendar day was acquired simultaneously.
These images describe past observations and are not live warnings. For decisions about flights, shipping or personal safety, consult the relevant national weather agency. An eye’s appearance alone is not a reliable way to judge the hazard at a particular place on the ground.
Source & verification
This independently written summary is based on NASA’s original report, released 2026-11-03. Consult the source for research details, methods and subsequent updates. NASA does not sponsor or endorse this publication.
Further background: NOAA: extratropical transition.
 Astronaut Photograph Follows Utah’s Deeply Winding San Juan River
 Landsat View Reveals the Changing Shores of Southern Cyprus