NASA Uses PACE to Follow the Changing Colors of Autumn
Repeated observations help researchers track vegetation pigments across regions.
A wider view of fall
NASA researchers are using the PACE satellite’s Ocean Color Instrument to follow autumn vegetation change. An October 26 Earth Observatory report describes observations of changing red, yellow and green signals across large areas of the Northern Hemisphere.
What the instrument measures
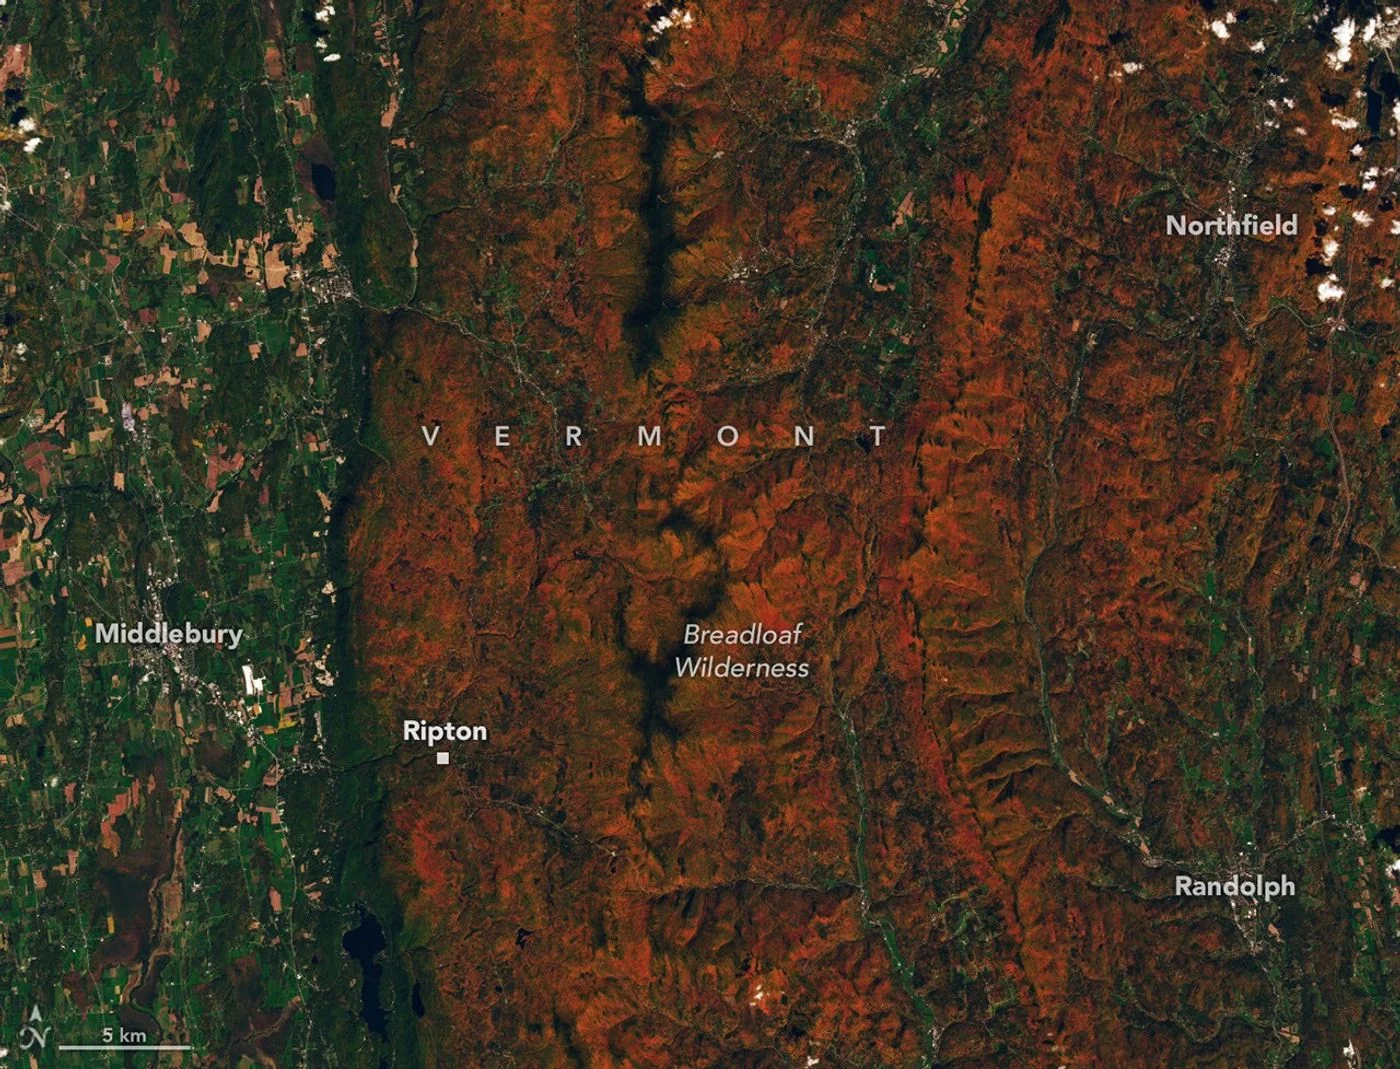
Different wavelengths help researchers examine pigments associated with leaf color. Repeated observations can reveal where seasonal changes progress and when particular signals peak. A separate Landsat 9 image from October 3 supplies a closer view of autumn-colored ridges near Ripton, Vermont.
Checking from the ground
The report also describes public photographs submitted through the GLOBE program to help check satellite observations. Interpretation needs care: crops, vegetation stress and clouds can affect the signal. A red patch in a satellite product does not automatically mean a forest has reached peak autumn color.
Background and interpretation. The following sections add editorial explanation to the dated report. Hypothetical examples are illustrations, not newly reported events or interviews.
Why an ocean instrument can also examine land
An instrument's name describes its mission context, not an absolute boundary around what its observations can reveal. NASA's background on PACE explains that its hyperspectral measurements can be applied to vegetation as well as ocean studies. The key is the information carried by reflected light across wavelengths. A forest, like a water surface, interacts with incoming sunlight in ways that can be measured. Using that information over land requires suitable analysis; it is not simply a matter of looking at an attractive colour photograph and assigning a biological meaning to every visible shade.
From a colour impression to a spectral pattern
The colours a person sees are a compressed impression of light. Spectral measurements provide a more detailed way to examine differences across wavelengths. NASA's vegetation discussion identifies chlorophyll, anthocyanins and carotenoids as pigments relevant to interpreting PACE observations. The broader lesson is that similar-looking green or red patches may contain information that is not obvious to the eye. This does not mean the instrument reads a leaf's entire condition directly. It means researchers can investigate particular signals using a defined measurement and a method appropriate to the question.
The importance of repeated observations
Autumn is a progression rather than a single colour state. A photograph can show that a landscape looked a certain way on a particular day, while a sequence can help investigate when changes began, how they developed and when a signal peaked. The sampling interval matters because the most rapid part of a change could occur between observations. Cloud cover can also interrupt the record. A sound explanation keeps missing periods visible instead of treating every calendar day as equally observed or assuming that a smooth-looking display contains measurements for every moment shown.
A forest is not one leaf
A satellite observes areas containing many surfaces. Within a wooded landscape there may be different tree types, openings, shadows, water and human-made features. Their contributions can mix within the measured signal. This makes a regional vegetation observation different from a laboratory measurement of an individual leaf. It also explains why interpretation requires attention to scale. A useful headline about autumn across a broad area should not imply that researchers diagnosed the exact biological condition of each tree visible beneath the satellite, or that every part of a measured area changed at the same pace.
Why two satellites can tell complementary stories
The article pairs a broad account of seasonal monitoring with a closer landscape view. Those images do not have to serve the same purpose. One can help place a local scene within a regional progression, while the other can make landform and vegetation patterns easier to see. The important point is to identify which instrument produced each observation and which date belongs to it. Combining pictures without those labels could suggest a simultaneous or equally detailed comparison that the underlying acquisitions do not support. Clear captions turn the difference in scale into an advantage.
A hypothetical comparison between two autumns
Suppose the most prominent red signal in a region appears earlier in one year than another. That result would invite questions about timing, observation coverage and the mix of surfaces being compared. It would not, by itself, establish a single cause. A useful investigation would define the region consistently and examine whether the measurement method was comparable. The example illustrates a general principle of seasonal analysis: detecting a difference and explaining that difference are separate steps. A good science story should help the reader follow both steps rather than collapse them into an immediate causal claim.
What the observations cannot promise a visitor
A regional satellite product is not a guarantee of peak colour on a particular walking route. Conditions can differ within the area represented by a broad observation, and the experience of a place depends on viewing direction, weather and local vegetation. This distinction does not reduce the scientific value of the measurements. It simply separates a research question about seasonal patterns from a travel question about a specific place on a specific day. Readers should avoid converting a dated science image into a precise visitor forecast that its source did not provide.
How to recognize a stronger explanation
A strong account identifies the measured signal, the spatial scale and the reference period before discussing biological interpretation. It also distinguishes the observation from any model or derived indicator. A colour legend can help, but only if the reader knows what the colours represent. Are they a natural-looking image, a selected wavelength combination or an analytical product? That question is particularly important when sharing a picture outside its original page. Retaining the product description prevents an appealing visualization from being mistaken for a direct photograph of exactly what a human observer would see.
The larger significance of the example
The PACE story shows how an observation system can support questions beyond the environment most strongly associated with its name. The scientific opportunity comes from the properties of the measurement, while the responsibility lies in explaining what the measurement can and cannot establish. Autumn provides an accessible subject because readers recognize seasonal colour change. The expanded context turns that familiarity into a more precise understanding of wavelength information, sampling and scale, without suggesting that a satellite view alone supplies a complete explanation for the condition of every forest it crosses.
A measured signal and an index have different roles
An analytical indicator is produced by applying a defined method to observations. It should not be confused with the entire original measurement or with a direct count of a biological feature. For readers, the practical distinction is to ask what the instrument recorded and what the subsequent analysis calculated. A legend may make an indicator easy to interpret visually, but its meaning still depends on the method. The PACE example is useful because it connects a familiar seasonal appearance with this less familiar chain from observation to analysis. Understanding the chain makes it easier to compare products without assuming that similar display colours mean identical measured quantities.
The image here is a real Landsat observation, not a generated woodland scene. Its date belongs to the pictured landscape. Readers comparing foliage reports should distinguish the day an image was taken from the later day a research summary or news article was published.
Source & verification
This independently written summary is based on NASA’s original report, released 2026-10-26. Consult the source for research details, methods and subsequent updates. NASA does not sponsor or endorse this publication.
Further background: NASA: vegetation observed with PACE.
 Astronaut Photograph Follows Utah’s Deeply Winding San Juan River
 Landsat View Reveals the Changing Shores of Southern Cyprus